
雅思备考规划
扫码添加助教免费咨询雅思备考规划

扫码下载 新东方雅思Pro APP,雅思备考一站式工具
新东方在线雅思为大家整理了2021雅思Task1小作文柱状图范文之价格变动,烤鸭们快来看看吧。
话题
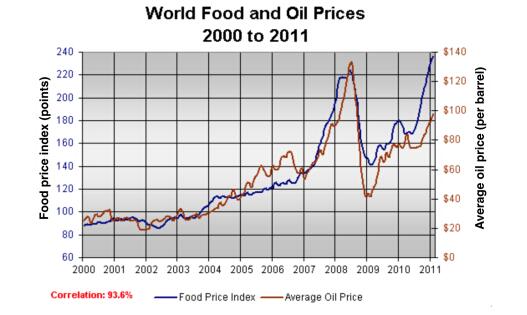
The graph below shows changes in global food and oil prices between 2000 and 2011.
范文
The line graph compares the average price of a barrel of oil with the food price index over a period of 11 years.
It is clear that average global prices of both oil and food rose considerably between 2000 and 2011. Furthermore, the trends for both commodities were very similar, and so a strong correlation (93.6%) is suggested.
In the year 2000, the average global oil price was close to $25 per barrel, and the food price index stood at just under 90 points. Over the following four years both prices remained relatively stable, before rising steadily between 2004 and 2007. By 2007, the average oil price had more than doubled, to nearly $60 per barrel, and food prices had risen by around 50 points.
A dramatic increase in both commodity prices was seen from 2007 to 2008, with oil prices reaching a peak of approximately $130 per barrel and the food price index rising to 220 points. However, by the beginning of 2009 the price of oil had dropped by roughly $90, and the food price index was down by about 80 points. Finally, in 2011, the average oil price rose once again, to nearly $100 per barrel, while the food price index reached its peak, at almost 240 points.
 资料下载
资料下载
雅思口语题库
发布时间:2025-04-15关注新东方在线雅思公众号
回复【口语题库】获取
雅思备考资料大合集
发布时间:2025-02-06关注新东方在线雅思公众号
回复【合集】获取
雅思考试回忆合集
发布时间:2023-08-09关注新东方在线雅思公众号
回复【回忆】获取
雅思学术词
发布时间:2023-08-04关注新东方在线雅思公众号
回复【学术词】获取
雅思阅读长难句50句
发布时间:2023-08-04关注新东方在线雅思公众号
回复【长难句】获取
50组雅思口语短语
发布时间:2023-08-09关注新东方在线雅思公众号
回复【短语】获取
雅思口语Part2答案示范15篇PDF下载
发布时间:2023-07-26添加新东方在线雅思助教号
回复【P2】获取
雅思小作文35组必备表达PDF下载
发布时间:2023-07-26添加新东方在线雅思助教号
回复【35】获取
雅思阅读高频短语PDF下载
发布时间:2023-07-20添加新东方在线雅思助教号
回复【短语】获取
200组雅思写作高频词汇PDF下载
发布时间:2023-07-20添加新东方在线雅思助教号
回复【200】获取
雅思写作话题词汇PDF下载
发布时间:2023-07-16添加新东方在线雅思助教号
回复【话题】获取
50组雅思口语同义替换词PDF下载
发布时间:2023-07-10添加新东方在线雅思助教号
回复【替换】获取
雅思写作大作文精选题目101PDF下载
发布时间:2023-07-09添加新东方在线雅思助教号
回复【101】获取
雅思口语核心300词PDF下载
发布时间:2023-06-23添加新东方在线雅思助教号
回复【300】获取
雅思阅读分类词汇PDF下载
发布时间:2023-06-17添加新东方在线雅思助教号
回复【分类词】获取
雅思口语必备习语PDF下载
发布时间:2023-06-17添加新东方在线雅思助教号
回复【习语】获取
雅思小作文常用词汇66词PDF下载
发布时间:2023-06-16添加新东方在线雅思助教号
回复【66】获取
雅思口语常见功能结构109句PDF下载
发布时间:2023-06-08添加新东方在线雅思助教号
回复【109】获取
10年雅思写作题库PDF下载
发布时间:2023-06-08添加新东方在线雅思助教号
回复【写作话题】获取
雅思图表作文精选套句50句PDF下载
发布时间:2023-05-28添加新东方在线雅思助教号
回复【50】获取
雅思写作99组高频词汇PDF资料
发布时间:2023-05-28添加新东方在线雅思助教号
回复【99】获取
2023年5月雅思口语新题题库PDF版本
发布时间:2023-05-14添加新东方在线雅思助教号
回复【新题】获取
2023年5-8月雅思口语新题题库与解析PDF版本
发布时间:2023-05-06关注新东方在线考雅课程中心服务号
回复【新题】获取
雅思听力考点词汇PDF资料
发布时间:2023-04-27添加新东方在线雅思助教号
回复【考点词】获取
雅思听力机经词汇PDF资料
发布时间:2023-04-24添加新东方在线雅思助教号
回复【TL】获取
雅思口语Part1常见话题语料库PDF资料
发布时间:2023-04-20添加新东方在线雅思助教号
回复【Part1】获取
剑桥雅思阅读长难句50句PDF资料
发布时间:2023-04-19添加新东方在线雅思助教号
回复【长难句】获取
雅思阅读核心学术词汇表PDF资料
发布时间:2023-04-07关注新东方在线考雅课程中心服务号
回复【核心】获取
100个雅思写作观点词和替换词表达PDF资料
发布时间:2023-03-24关注新东方在线考雅课程中心服务号
回复【100】获取
雅思阅读分类词汇PDF资料
发布时间:2023-03-22关注新东方在线考雅课程中心服务号
回复【分类词】获取

添加新东方在线雅思助教,
回复【口语】获取雅思口语资料大礼包
 推荐阅读
推荐阅读
雅思大作文是许多准备雅思考试的考生们非常关注的一个部分,它不仅考察考生的语言表达能力,还考察逻辑思维和组织能力,为了帮助大家备考,本文为大家带来雅思大作文:针对儿童的广告越来越多是否应该加以控制。
来源 : 新东方在线雅思 2024-03-27 11:58:44 关键字 : 雅思考试 雅思考试题 雅思写作 雅思大作文
雅思大作文是许多准备雅思考试的考生们非常关注的一个部分,它不仅考察考生的语言表达能力,还考察逻辑思维和组织能力,为了帮助大家备考,本文为大家带来雅思大作文:是否同意国际社会采取行动确保国家减少对化石燃料的消费。
来源 : 新东方在线雅思 2024-03-27 11:53:29 关键字 : 雅思考试 雅思考试题 雅思写作 雅思大作文
雅思大作文是许多准备雅思考试的考生们非常关注的一个部分,它不仅考察考生的语言表达能力,还考察逻辑思维和组织能力,为了帮助大家备考,本文为大家带来雅思大作文:新市镇规划中公园设施是否比购物中心更重要。
来源 : 新东方在线雅思 2024-03-25 18:24:18 关键字 : 雅思考试 雅思考试题 雅思写作 雅思大作文
雅思大作文是许多准备雅思考试的考生们非常关注的一个部分,它不仅考察考生的语言表达能力,还考察逻辑思维和组织能力,为了帮助大家备考,本文为大家带来雅思大作文:是否同意政府应该为儿童超重和肥胖负责。
来源 : 新东方在线雅思 2024-03-25 18:08:59 关键字 : 雅思考试 雅思考试题 雅思写作 雅思大作文
雅思大作文是许多准备雅思考试的考生们非常关注的一个部分,它不仅考察考生的语言表达能力,还考察逻辑思维和组织能力,为了帮助大家备考,本文为大家带来雅思大作文:越来越多的体力工作是由机器完成的利弊。
来源 : 新东方在线雅思 2024-03-25 17:55:51 关键字 : 雅思考试 雅思考试题 雅思写作 雅思大作文


资料下载
关注新东方在线雅思公众号
回复【口语题库】获取
关注新东方在线雅思公众号
回复【合集】获取
关注新东方在线雅思公众号
回复【回忆】获取
关注新东方在线雅思公众号
回复【学术词】获取
关注新东方在线雅思公众号
回复【长难句】获取
关注新东方在线雅思公众号
回复【短语】获取
添加新东方在线雅思助教号
回复【P2】获取
添加新东方在线雅思助教号
回复【35】获取
添加新东方在线雅思助教号
回复【短语】获取
添加新东方在线雅思助教号
回复【200】获取
添加新东方在线雅思助教号
回复【话题】获取
添加新东方在线雅思助教号
回复【替换】获取
添加新东方在线雅思助教号
回复【101】获取
添加新东方在线雅思助教号
回复【300】获取
添加新东方在线雅思助教号
回复【分类词】获取
添加新东方在线雅思助教号
回复【习语】获取
添加新东方在线雅思助教号
回复【66】获取
添加新东方在线雅思助教号
回复【109】获取
添加新东方在线雅思助教号
回复【写作话题】获取
添加新东方在线雅思助教号
回复【50】获取
添加新东方在线雅思助教号
回复【99】获取
添加新东方在线雅思助教号
回复【新题】获取
关注新东方在线考雅课程中心服务号
回复【新题】获取
添加新东方在线雅思助教号
回复【考点词】获取
添加新东方在线雅思助教号
回复【TL】获取
添加新东方在线雅思助教号
回复【Part1】获取
添加新东方在线雅思助教号
回复【长难句】获取
关注新东方在线考雅课程中心服务号
回复【核心】获取
关注新东方在线考雅课程中心服务号
回复【100】获取
关注新东方在线考雅课程中心服务号
回复【分类词】获取
 编辑推荐
编辑推荐
雅思新题
 阅读排行榜
阅读排行榜
 相关内容
相关内容


 公开讲座
公开讲座 网友热搜
网友热搜